Rapid Drawdown in Dam and Levee Design: A Hydrogeologic Perspective in Slide2 Sponsored
What happens to a dam or levee when the reservoir that once supported it drops rapidly?
From the outside, rapid drawdown may appear to be a simple operational change: the water level falls while the structure remains unchanged. Beneath the surface, however, the response is far more complex. Pore pressures within the embankment do not dissipate at the same rate as the reservoir level, creating a temporary but potentially dangerous imbalance between internal groundwater conditions and external hydraulic support.
This mismatch can significantly reduce slope stability. If it is not explicitly accounted for in analysis, post-drawdown safety may be substantially overestimated.
Dams and levees are not static earth structures. They are hydro-mechanical systems whose behaviour depends on the interaction between soil strength, groundwater flow and stress redistribution over time. Rapid drawdown represents one of the most demanding conditions these systems encounter.
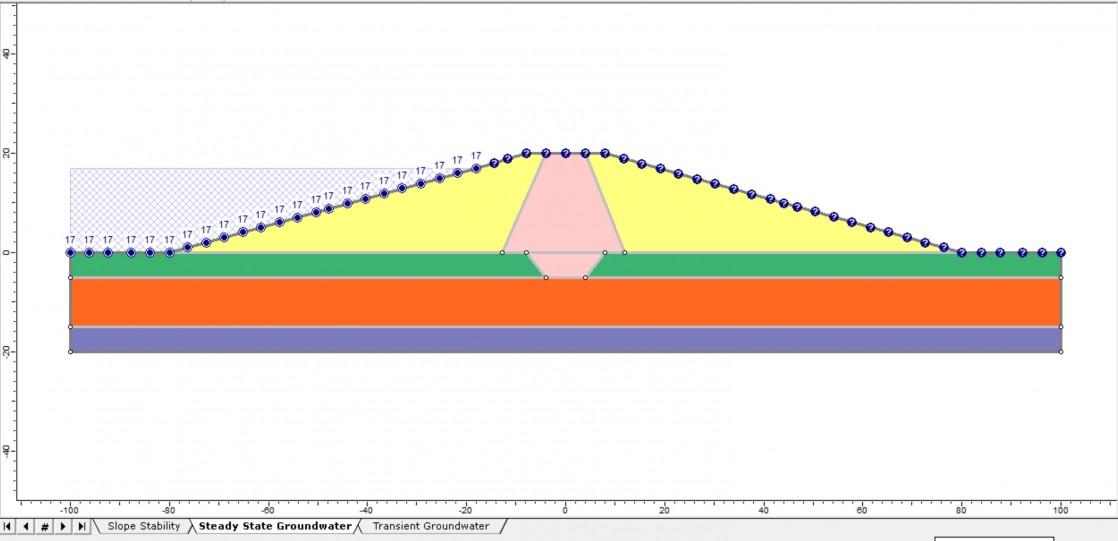
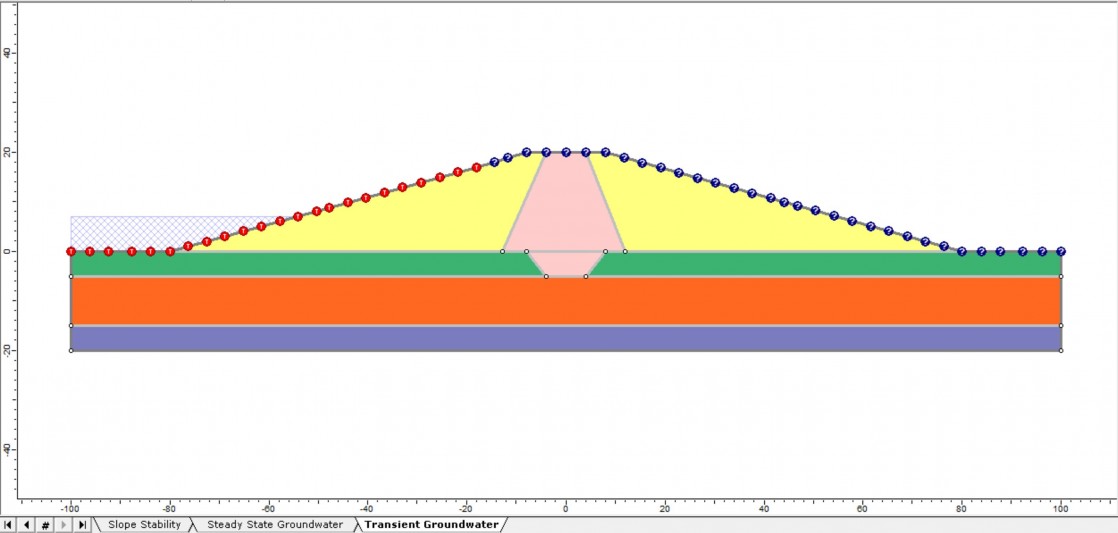
In Slide2, gradual drawdown conditions can be analyzed by combining transient groundwater seepage analysis with slope stability analysis. The initial reservoir level is defined as a steady-state condition, while the lowering of the water level is represented through multiple time-dependent boundary stages. This staged approach allows engineers to track how pore pressure distributions evolve within the embankment as the external water level recedes.
Modelling Gradual Drawdown with Transient Seepage
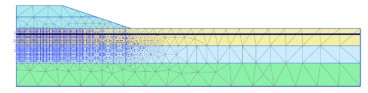
The model in figures 1 and 2 shows how reservoir levels can be reduced in controlled stages. Each stage updates groundwater boundary conditions, allowing the internal pore pressure field to evolve as the reservoir level changes.
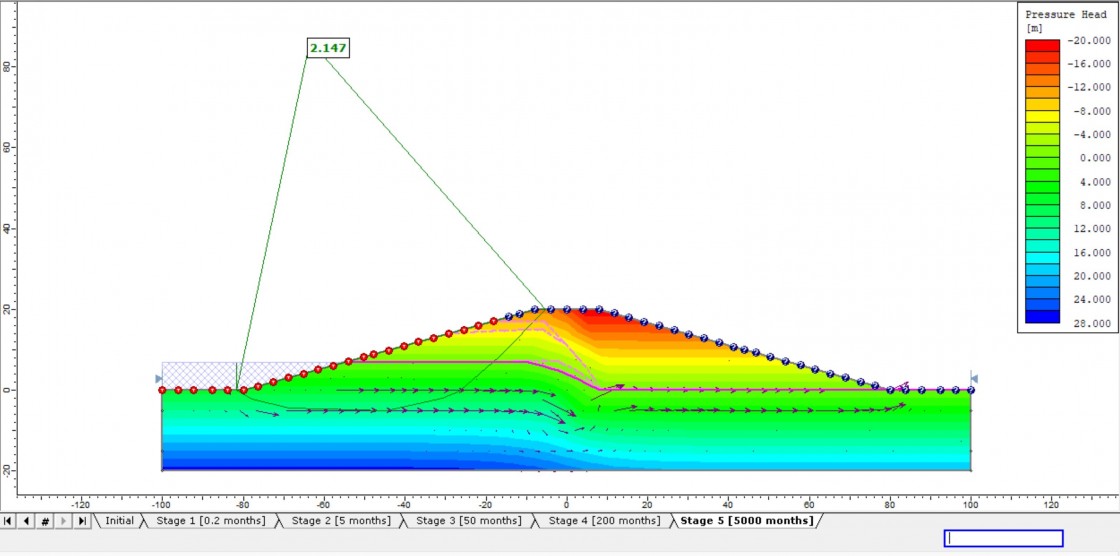
Once the analysis is complete, engineers can examine results for water level, pore pressure and hydraulic head at each stage. Slide2 also identifies the critical slip surface and corresponding factor of safety throughout the drawdown process.
Following the analysis, results for water level, pore pressure, and hydraulic head can be reviewed for each stage. The critical slip surface and corresponding factor of safety can also be obtained at different points in time during drawdown, enabling a detailed picture (shown in figure 3) of how stability evolves as the reservoir drops.
However, when the external water level falls quickly while pore pressures remain high – because of very low‑permeability materials – a full transient analysis may be impractically long to reach the post‑drawdown state. In such cases, the Rapid Drawdown feature in Slide2 addresses this problem directly by integrating hydrogeologic assumptions into limit equilibrium slope stability analysis, allowing engineers to evaluate how different drawdown mechanisms influence pore pressures, effective stresses, and ultimately, the factor of safety.
Why Hydrogeology Governs Rapid Drawdown Behaviour
Rapid drawdown is fundamentally a groundwater response problem.
When reservoir levels fall, pore pressures within the embankment do not immediately follow the external water level. The rate at which these pressures dissipate depends primarily on soil hydraulic properties such as permeability and compressibility.
From a stability perspective, three processes occur simultaneously:
-
External hydrostatic support from ponded water on the upstream slope is reduced or removed.
-
Internal pore pressures remain elevated, particularly in low-permeability soils where excess pore pressure dissipates slowly.
-
Effective stresses decrease because total stresses at the slope face drop faster than internal pore pressures, reducing available shear resistance.
The result is a transient condition in which the upstream slope may be significantly less stable than under either full-reservoir or long-term drained conditions.
Slide2 captures this interaction through its Advanced Groundwater Options, which require explicit definition of both the initial water table and the final drawdown water level.
Rapid Drawdown Modelling in Slide2
To perform rapid drawdown analysis in Slide2, the Water Surface groundwater method is selected as the groundwater method. Two water tables are defined:
-
the initial reservoir water level
-
the drawdown level
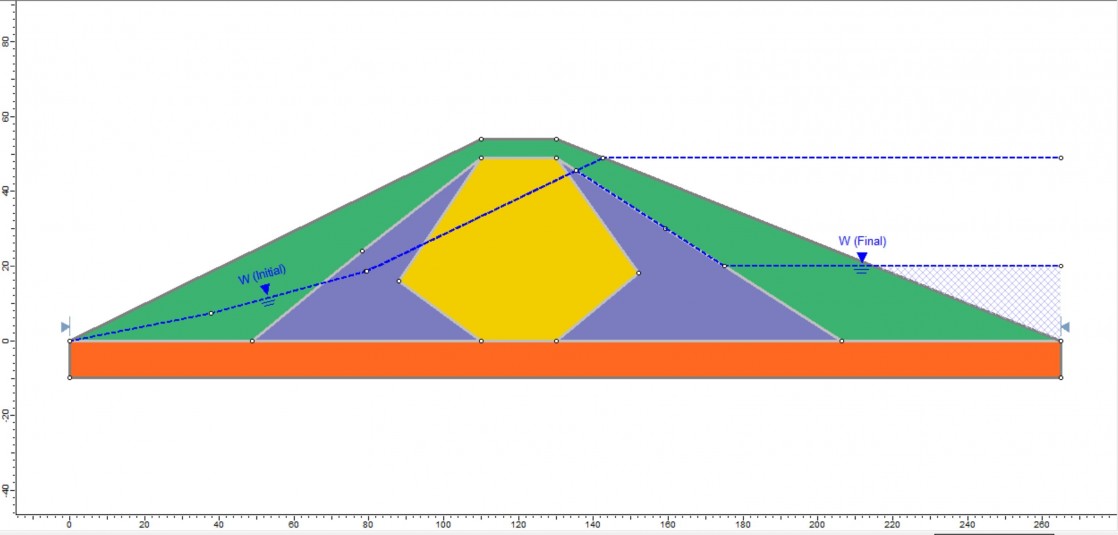
Rapid drawdown does not always occur at ground level. In many operational scenarios, reservoirs are lowered only to intermediate elevations. Slide2 allows these partial drawdown conditions to be modelled explicitly using the drawdown line definition.
Under partial drawdown conditions, pore pressures may remain elevated near the upstream toe or within transition zones, even after external hydraulic support has been reduced. This combination can produce lower factors of safety than either full reservoir or complete drawdown conditions. When no drawdown line is specified, Slide2 assumes a complete drawdown to ground level.
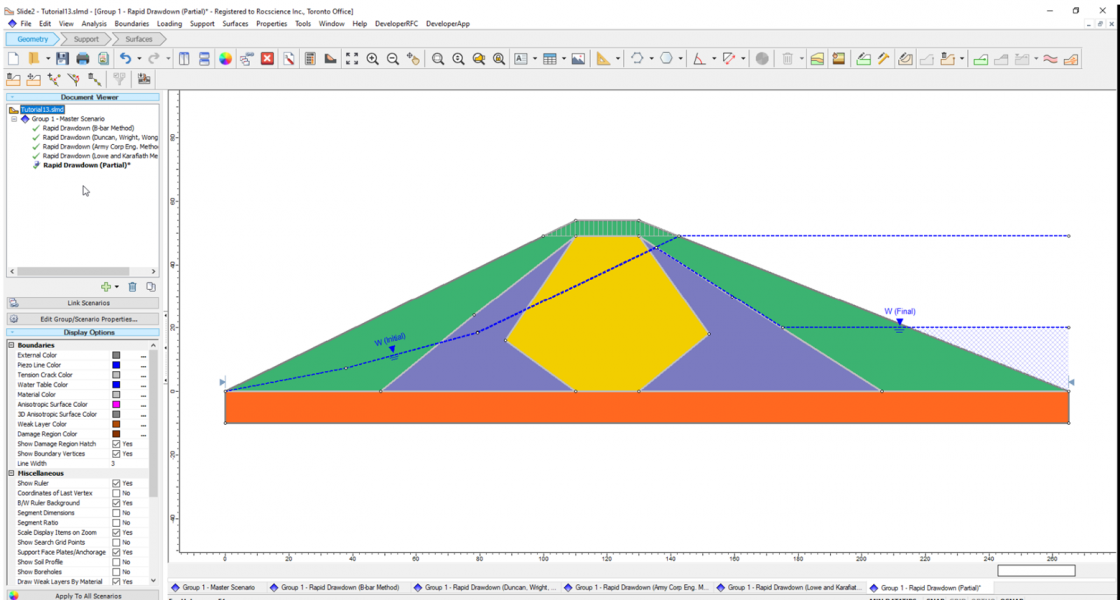
The explicit separation between initial and final water levels is critical. The geometry and position of the water table control pore pressure distributions within the embankment, which in turn influence where critical slip surfaces develop after drawdown.
It is important to note that Slide2 does not simulate rapid drawdown using a full transient seepage analysis. Instead, it applies established rapid drawdown methods to estimate pore pressures for both the initial and lowered water levels, allowing engineers to evaluate stability directly under post-drawdown conditions.
Rapid Drawdown Methods in Slide2
Slide2 includes four established methods for analyzing rapid drawdown:
-
Effective Stress using B-bar
-
Duncan, Wright and Wong (1990) three-stage method
-
U.S. Army Corps of Engineers (1970) two-stage method
-
Lowe and Karafiath (1960) method
These methods are available within Advanced Groundwater Options in the Project Settings.
Effective Stress (B-bar) Method
In Slide2, the B-bar method is implemented by selecting the Effective Stress rapid drawdown option and assigning a B-bar value to each material to represent its drainage behaviour.
This method models excess pore pressure generation as proportional to the change in vertical stress during drawdown, as expressed in the equation below:

A B-bar coefficient greater than zero produces a negative pore pressure change for materials located beneath ponded water. However, a B-bar value of zero does not represent fully drained behaviour. Instead, it indicates that pore pressures remain unchanged from the initial full-reservoir condition.
Materials with higher B-bar values, typically associated with lower permeability or more undrained behaviour, retain a larger portion of excess pore pressure after drawdown. Free-draining materials allow pore pressures to dissipate towards the lowered water level.
This approach is particularly transparent, because changes in stability can be traced directly to the assumed drainage behaviour, making it well suited for sensitivity studies and comparative assessments of different hydrogeologic scenarios.
Duncan, Wright and Wong (1990) Three-Stage Method
The Duncan-Wright-Wong method uses a three-stage procedure for modelling rapid drawdown behaviour. Slide2 implements it automatically once this option is selected, based on the drained and undrained strength definitions assigned to each material.
- Stage 1. Full reservoir (steady state)
Stability is analyzed with the reservoir at its full level using effective stress parameters. The resulting effective stresses along the slip surface are used to determine undrained shear strengths for low-permeability materials. - Stage 2. Post drawdown with undrained low permeability materials
The analysis is repeated with the reservoir at the final lowered water level. Drained strength parameters are used for free-draining materials, while undrained strengths obtained in Stage 1 are applied to low-permeability soils. - Stage 3. Consistency check and final factor of safety
The final factor of safety is calculated by verifying whether effective stresses after drawdown would mobilize drained strengths lower than the undrained strengths used in Stage 2. For each occurrence, drained strength replaces undrained strength, and the analysis is repeated to obtain the final factor of safety.
U.S. Army Corps of Engineers (1970), Two-Stage Method
The U.S. Army Corps method evaluates drawdown using a two-stage limit equilibrium procedure.
The analysis applies the total stress R-envelope for undrained materials while incorporating drained behaviour where appropriate. Because the method relies less on effective stress recovery than other frameworks, it often produces more conservative post-drawdown factors of safety.
Lowe and Karafiath (1960) Method
The Lowe and Karafiath method is conceptually similar to the Duncan-Wright-Wong approach. However, it omits the third stage that checks whether drained strengths should replace undrained strengths after drawdown.
In Slide2, the method uses the same material inputs as the Duncan-Wright-Wong procedure but provides a simplified evaluation framework when a full three-stage analysis is not required.
Interpreting Rapid Drawdown Results in Slide2
Post-drawdown analyses can reveal not only reductions in factor of safety but also significant changes in the location and geometry of the critical slip surface. As pore pressure distributions change, the governing failure mechanism may shift deeper into the embankment or migrate toward the upstream face.
The following figures below highlight how the critical slip surface may migrate as internal pore pressures remain elevated while the external reservoir support is removed.
Slide2 also allows engineers to plot and evaluate slip surface data including:
- initial pore water pressure
- final pore water pressure
- excess pore pressure distribution
The following figures demonstrate how Slide2 visualises slip surface data, including initial and final pore water pressures and excess pore pressures. These outputs reveal which zones control stability during drawdown and how hydrogeologic assumptions affect the outcome.
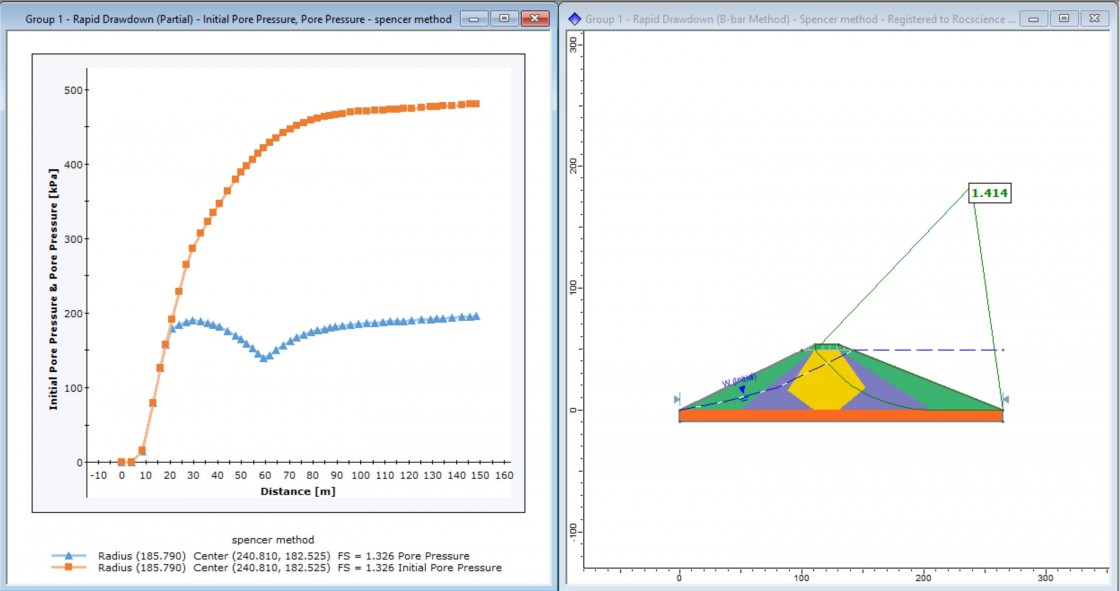
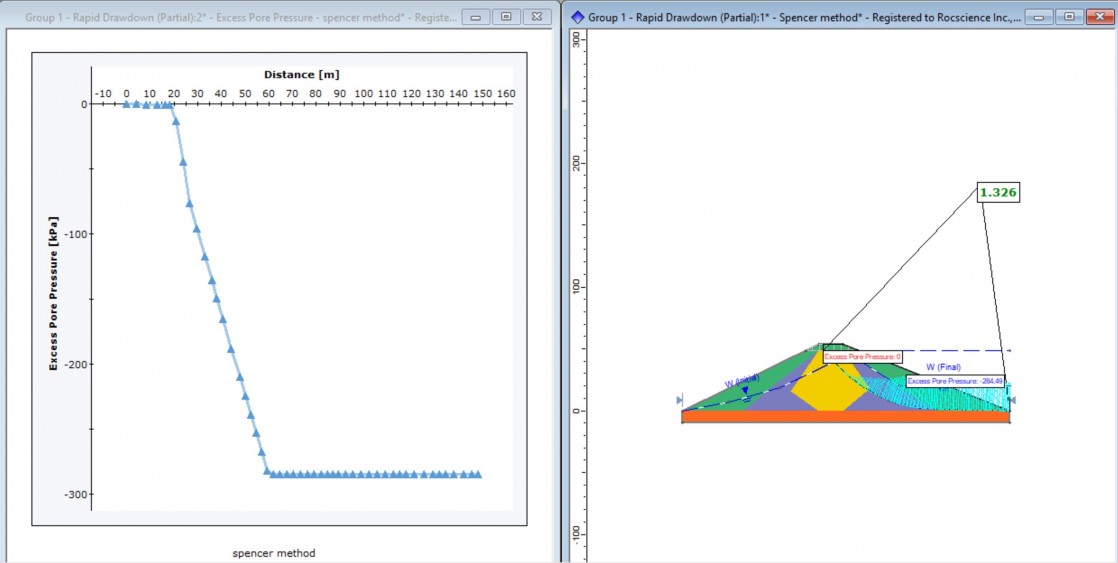
These plots provide insight into which regions of the embankment control post-drawdown stability and how hydrogeologic assumptions influence the factor of safety.
Why Slide2’s Hydrogeologic Approach Matters
Rapid drawdown is not an edge case in dam and levee engineering — it is a defining condition that tests whether hydrogeology has been properly integrated into stability assessment.
By embedding multiple rapid drawdown frameworks directly into slope stability analysis, Slide2 allows engineers to explore how different groundwater response assumptions affect post-drawdown behaviour, without stepping outside a consistent modelling environment.
When hydrogeology is treated as a first-order input rather than a background assumption, rapid drawdown shifts from an uncertainty to an analyzable condition. That is where Slide2 provides its greatest value: not by predicting exactly how water will move, but by revealing how stability responds when it does not move fast enough.
Authors: Leila Baninajarian, Geotechnical Application Engineer, Sina Javankhoshdel, Senior Manager - LEM
Want to read more like this story?

Importing pore-water pressure results from SEEP3D into a two-dimensional SLOPE/W analysis
Mar, 02, 2026 | NewsThis example replicates the “Rapid drawdown” examples illustrated in SEEP/W and SIGMA/W. The purpos...

Pore-Water Pressure Definition for a Levee Stability Analysis
Feb, 24, 2026 | NewsThis example explores the effect of a flood event on the stability of a levee underlain by a confin...

How to Perform Dewatering in PLAXIS
Jun, 11, 2021 | NewsThe problem of changing water conditions is omnipresent in geotechnical engineering. Groundwater is...
Consolidation Analysis for Embankments
Aug, 12, 2022 | NewsConstruction of embankments on soft soil presents a challenge. Soft soil deposits have a high moist...

Slope Stability of Embankments on Clay
Aug, 23, 2022 | NewsThe construction of an embankment on clay can generate excess pore pressure in the clay, causing sl...

GEOSTASE Slope Stability Analysis
Mar, 20, 2019 | Software
Using GeoStudio to conduct 3D numerical analysis of groundwater seepage and stability at the Ripley Landslide site
Jul, 30, 2024 | NewsLandslides come with significant potential for loss of life and damage to integral infrastructur...

GEO5 Slope Stability – Water Flow
Jan, 19, 2023 | Software
Slope Stability: Critical Failure Surface & Design Factor of Safety
Jun, 18, 2021 | EducationCritical Failure Surface As discussed in the previous chapters of the Geoengineer.org series on Slo...
Form
Looking for more information? Fill in the form and we will contact Rocscience Inc. for you.
On This Day
June 21st 1781
READ MORE
Trending

New crustal stress map of North America

Using Terzaghi’s Equation in Foundation Design

Parameters Variation: Model Customization and Sensitivity Analyses

UK geothermal projects expand from Cornwall power to Birmingham heating
Stop Guessing, Start Designing: Introducing Support Designer in Slide2

Development program prepares new engineers for success